works fine when you use pycharm to connect to programs on a Linux server. But can not be debugged, debugging time is special card, and variable window variables can not load out
tried to expand the memory of pycharm, but failed.
pycharm website for the solution of the method can effectively solve the: https://blog.jetbrains.com/pycharm/2012/08/gevent-debug-support/ p>
is recorded here:
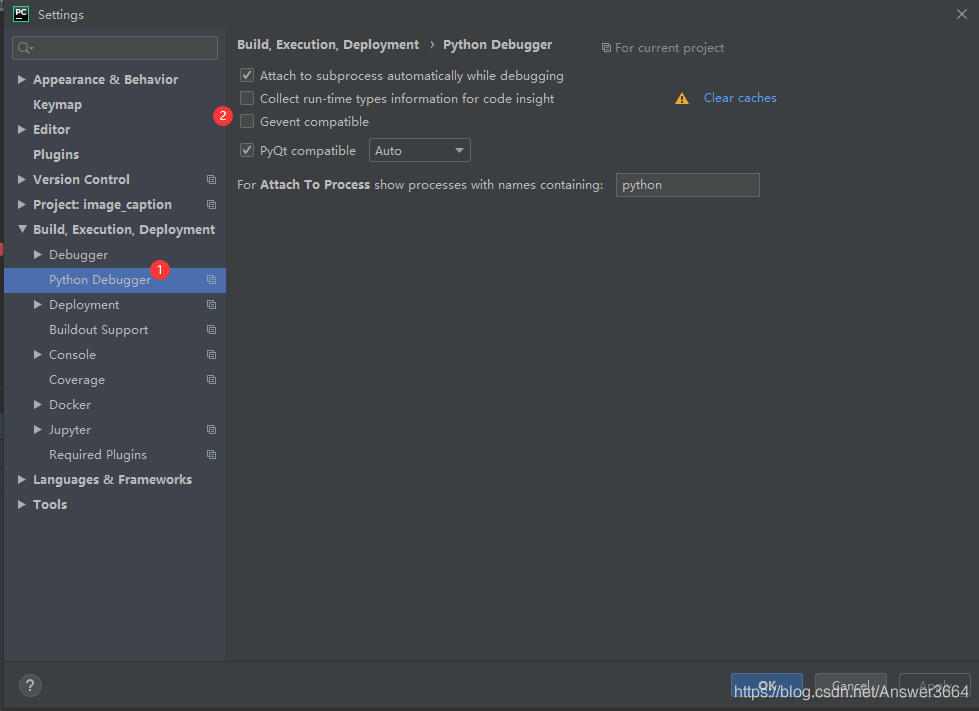
file-> setting-> python debugger
and then check the box in front of the Gevent compatible.
p>
Read More:
- Compatibility of mobile display frame
- Unable to initialize GTK: could not open display
- The solution of PDF file unable to display thumbnail in win7
- TIP: Unable to initialize gtk, is DISPLAY set properly?
- pycharm Failed to connect to github.com port 443: Timed out
- Practice — CSS3 — frame animation to achieve special effects
- Win10 desktop right click display settings MS- settings:display Or Ms- settings:personalization-background resolvent
- Pycharm: cann‘t find declaration to go
- Causes and solutions of black frame flashback after debugging visual studio 2017
- Solution to the incomplete display of big data files printed by pychar
- Error starting ApplicationContext. To display the conditions report re-run your application with
- Can’t open display: can’t open display: localhost:10.0
- Fixed Frame [base_link] does not exist
- Solution to page scroll bar failure caused by opening secondary spring frame in Ant Design modal form
- Dependency frame package of Maven Alibaba JSON
- Renaming the column name of data frame in R language
- Attempt to reset the display driver and recover from timeout failed
- Error starting ApplicationContext. To display the conditions report re-run your application with ‘de
- Abnormal display of page object moved to here
- Pychart remote debugging display picture, tkagg error report troubleshooting