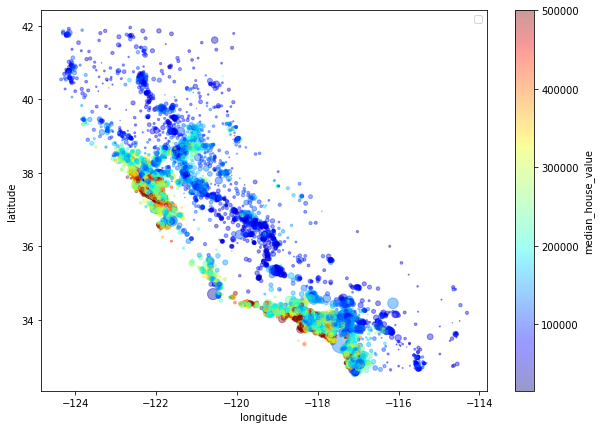
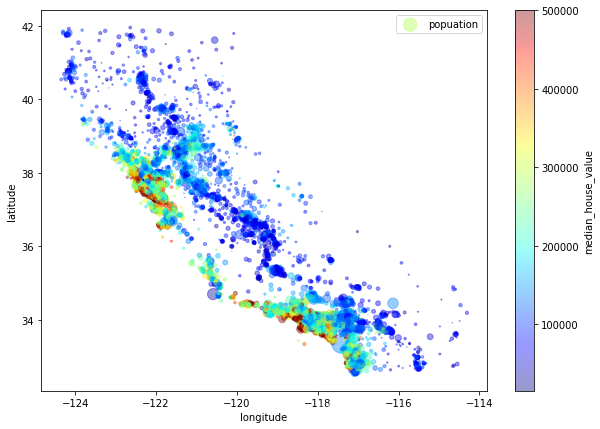
housing.plot(kind="scatter", x="longitude", y="latitude", alpha=0.4,
             s=housing["population"]/100, label="population", figsize=(10,7),
             c="median_house_value", cmap=plt.get_cmap("jet"), colorbar=True,
             sharex=False)
plt.legend()
TypeError: object of type ‘NoneType’ has no len()
After removing label =’population ‘, the picture can be displayed

but a new warning appears
No handles with labels found to put in legend.

I didn’t finish the adjustment for two hours until I updated Matplotlib:) it is OK.